Performance And Debugging Tools: TCS
|
WARNING: SciNet is in the process of replacing this wiki with a new documentation site. For current information, please go to https://docs.scinet.utoronto.ca |
Memory Profiling
PurifyPlus
This is IBM/Rational's set of tools for memory profiling and code testing. Specifically, the tools are: purify, purecov and quantify.
In order to gain access to these tools, you need to source the script that defines them to your shell:
source /scinet/tcs/Rational/purifyplus_setup.sh
The documentation for getting started with these tools is in the directory:
/scinet/tcs/Rational/releases/PurifyPlus.7.0.1/docs/pdf
or here: PurifyPlus Getting Started.
Debugging
dbx
dbx is source-language level serial debugger for aix; it works more or less like gdb for stepping through code. For it to be useful, you have to have compiled with symbol information in the executable, eg with -g.
Performance Profiling
gprof
gprof is a very useful tool for finding out where a program is spending its time; its use is described in our Intro To Performance. You compile with -g -pg and run the program as usual; a file named gmon.out is created, which one can use via the gprof program to see a profile of your program's execution time.
Xprofiler
Xprof is an AIX utility for graphically displaying the output of profiling information; it's equivalent to gprof but gives a better `bird's-eye view' of large and complex programs. You compile your program with -pg -g as before but run Xprof on the output:
Xprof program_name gmon.out
Performance counters
hpmcount
On the TCS, hpmcount allows the querying of the performance counter values in the CPUs themselves over the course of a run. Since here we are simply asking the CPU to report values it obtains during the run of a program, the code does not need to be instrumented; simply typing
hpmcount hpmcount_args program_name program_args
runs the job as normal and reports the counter results at the end of the run.
hpmcount -d -s 5,12 program_name program_args
reports counter sets 5 and 12, which are very useful for showing memory performance (showing L1 and L2 cache misses) and set 6 is especially useful for shared memory profiling, giving statistics about how often off-processor memory had to be accessed. More details are available on our Introduction to Performance or from the IBM website.
Performance logging
PeekPerf
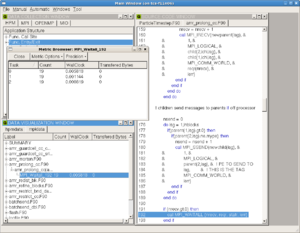
Peekperf is IBM's single graphical `dashboard' providing access to many performance measurement tools for exmaining Hardware Counter data, threads, message passing, IO, and memory access, several of which are available seperately as command-line tools. Its use is described in our Intro to Performance.
MPE/Jumpshot
MPI defines a profiling layer which can be used to intercept MPI calls and log information about them. This is used by the peekperf package above to instrument code by inserting function calls. The same library and tools can be used manually: eg
$ mpCC -pg a.c -o a.out -L/usr/lpp/ppe.hpct/lib64 -lmpitrace
$ mpiexec -n 2 ./a.out-hostfile HOSTFILE
$ peekview result.viz
(where HOSTFILE is a file containing the TCS devel node hostname; see our FAQ entry for interactive running on the TCS nodes.) The above will use peekview to show the results for up to three of the MPI tasks (those with the minimum, median, and maximum MPI time, respectively); to get more output, one can set the environment variable
export OUTPUT_ALL_RANKS=yes
More information is available online.
Another tool which performs the same task but generates more detailed output is the MPE tools put out by Argonne National Lab. On the TCS, these can be accessed by typing
module load mpe
and then using the mpe wrappers to compile your program: eg
module load mpe
mpefc -o a.out a.F -mpilog
mpecc -o a.out a.c -mpilog
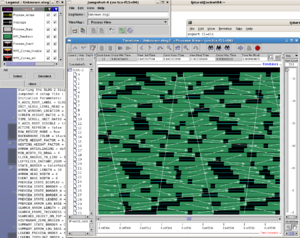
Running your program as above will generate a log file named something like Unknown.clog2; you can convert this to a format suitable for viewing and then use the jumpshot interactive trace viewing tool,
clog2TOslog2 Unknown.clog2
jumpshot Unknown.slog2
Note that this tries to open xwindows, so you will have had to login with ssh -X or ssh -Y into both login.scinet and tcs01 or tcs02.
To use MPE logging on a batch job, you must specify the MPE path and library path in your batch script:
#
# LoadLeveler submission script for SciNet TCS: MPI job
#
#@ job_name        = testmpe
#@ initialdir      = /scratch/YOUR/DIRECTORY
#
#@ tasks_per_node  = 64
#@ node            = 2
#@ wall_clock_limit= 0:10:00
#@ output          = $(job_name).$(jobid).out
#@ error           = $(job_name).$(jobid).err
#
#@ notification = complete
#@ notify_user  = user@example.com
#
# Don't change anything below here unless you know exactly
# why you are changing it.
#
#@ job_type        = parallel
#@ class           = verylong
#@ node_usage      = not_shared
#@ rset = rset_mcm_affinity
#@ mcm_affinity_options = mcm_distribute mcm_mem_req mcm_sni_none
#@ cpus_per_core=2
#@ task_affinity=cpu(1)
#@ environment = COPY_ALL; MEMORY_AFFINITY=MCM; MP_SYNC_QP=YES; \
#                MP_RFIFO_SIZE=16777216; MP_SHM_ATTACH_THRESH=500000; \
#                MP_EUIDEVELOP=min; MP_USE_BULK_XFER=yes; \
#                MP_RDMA_MTU=4K; MP_BULK_MIN_MSG_SIZE=64k; MP_RC_MAX_QP=8192; \
#                PSALLOC=early; NODISCLAIM=true
#

MPEDIR=/scinet/tcs/mpi/mpe2-1.0.6
export PATH=${MPEDIR}/bin:${MPEDIR}/sbin:${PATH}
export LD_LIBRARY_PATH=${MPEDIR}/lib:${LD_LIBRARY_PATH}

YOUR-PROGRAM

#@ queue
Scalasca
Scalasca is a sophisticated tool for analyzing performance and finding common performance problems, installed on both TCS and GPC. We describe it in our Intro to Performance.

