Difference between revisions of "Performance and Profiling Course, April 2013"
Jump to navigation
Jump to search
m (→Links) |
m (→Links) |
||
| Line 22: | Line 22: | ||
*[[Introduction To Performance]] | *[[Introduction To Performance]] | ||
| − | *[[Performance And Debugging Tools: GPC]]and [[Performance_And_Debugging_Tools:_TCS | + | *[[Performance And Debugging Tools: GPC]] and [[Performance_And_Debugging_Tools:_TCS]] |
* Dec 2010 SNUG TechTalk: [[Media:ProfillingTechTalk-Dec2010.pdf | Profiling Tools on GPC]] | * Dec 2010 SNUG TechTalk: [[Media:ProfillingTechTalk-Dec2010.pdf | Profiling Tools on GPC]] | ||
* [http://cnx.org/content/col11136/latest/ High Performance Computing Book]<br />Online version of an older O'Reilly book which covers the basics of (mostly serial) programming for performance. Covers the most important issues today very clearly. | * [http://cnx.org/content/col11136/latest/ High Performance Computing Book]<br />Online version of an older O'Reilly book which covers the basics of (mostly serial) programming for performance. Covers the most important issues today very clearly. | ||
Revision as of 13:46, 25 April 2013
Goal
This was a half-day course given on March 24, 2013 at SciNet, covering using profiling and performance tuning strategies using open source tools as well as Intel and Allinea tools, which are available on SciNet's GPC cluster.
Topics (with lecture slides and recordings)
Part 1: Profiling and performance tuning with open source tools
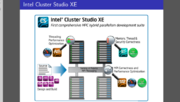
Part 2: Intel tools
Part 3: Allinea MAP profiler
Links
- Introduction To Performance
- Performance And Debugging Tools: GPC and Performance_And_Debugging_Tools:_TCS
- Dec 2010 SNUG TechTalk: Profiling Tools on GPC
- High Performance Computing Book
Online version of an older O'Reilly book which covers the basics of (mostly serial) programming for performance. Covers the most important issues today very clearly. - How to Write Fast Numerical Code
Good introduction to thinking about performance. - Performance tuning
- MPI Tuning Parameters - SNUG TechTalk, Feb 2012